Cross-model comparison
Cross-model comparison asks whether two or more trained GRADIENDs agree on where and what they learned. Models may differ by class pair, base model, training objective, or random seed.
Start with the tutorial Evaluation (inter-model), then use this guide to pick the right metric.
Which comparison to run
Pick one lens per question: where weights changed (top-k, cosine), what signal they encode on data (cross-encoding), or how stable training was across seeds (dispersion). These views complement each other — high parameter overlap with low cross-encoding is a common and informative pattern (see Cross-encoding).
| Metric | Measures | Does not tell you | Advantages | Disadvantages |
|---|---|---|---|---|
| Top-k overlap | Overlap of each model's top-k important parameters (e.g. decoder weights) | Whether encoders separate another feature's gradients | Fast; scales to many runs; easy to read (Venn or heatmap) | Ignores weights outside top-k; sensitive to pre-prune topk |
| Cosine similarity | Agreement of full importance vectors (optionally top-k filtered or grouped by layer/component) | Per-token probability shifts or rewrite quality | Uses magnitudes and directions, not just set membership; supports grouped breakdowns | Less intuitive than overlap; high cosine can still disagree on which parameters matter most; not well tested |
| Cross-encoding | How well one GRADIEND's encoder separates another feature's snippets | Whether the same parameters were modified | Tests semantic signal on data; separates "same place, different feature" from entanglement | Requires encoder eval (additional computations); slower and setup-heavy |
| Seed dispersion | Spread of scalar metrics (e.g. encoder correlation) across convergent seeds | Whether any single seed converged; weight-space overlap between seeds | Compact reproducibility summary alongside means (Multi-seed analysis) | Needs analyze_seed_stability and multiple convergent seeds; use checkpoint similarity for weight agreement; does not compare different features! |
Comparison payloads
Most comparison functions return a dict usable for plotting or tables:
model_ids— row labelsmatrix— numeric valuescolumn_ids— column labels (rectangular comparisons)n_matrix,cell_stats— optional counts and seed dispersion
Plot with plot_comparison_heatmap(comparison_data, ...) or suite helpers below.
Top-k overlap
Best first comparison: easy to interpret, cheap to compute.
suite.plot_similarity_heatmap(metric="topk_overlap", value="intersection_frac")
# or standalone:
from gradiend.visualizer.topk.pairwise_heatmap import plot_topk_overlap_heatmap
models = {t.run_id: t.get_model() for t in trainers}
plot_topk_overlap_heatmap(models, topk=1000, value="intersection_frac")
Cell metric (value) — what each heatmap cell shows:
value |
Meaning | Use when |
|---|---|---|
"intersection" |
Raw count |A ∩ B| (API default) | Same topk everywhere; you want absolute overlap counts |
"intersection_frac" |
|A ∩ B| / min(|A|, |B|) — fraction of the smaller top-k set in the intersection | Comparing runs with different pruning or resolved set sizes; values lie in [0, 1] |
Also set part (decoder-weight, encoder-weight, …) and topk (count or fraction, e.g. 0.01 for top 1%). Full option list: Top-k overlap heatmap.
:material-file-code-outline: train_gender_de_detailed.py
High overlap → runs may reuse the same parameter subspace. Low overlap → distinct learned directions. This says nothing about whether one encoder separates another feature's gradients — use cross-encoding for that.
Similarity metrics
Cosine and rank-style metrics compare full importance vectors, not only a top-k cut.
Component grouping (embedding, attention, mlp, layer, lm_head) follows
Hugging Face naming. Custom architectures may need explicit group_by or ungrouped
inspection.
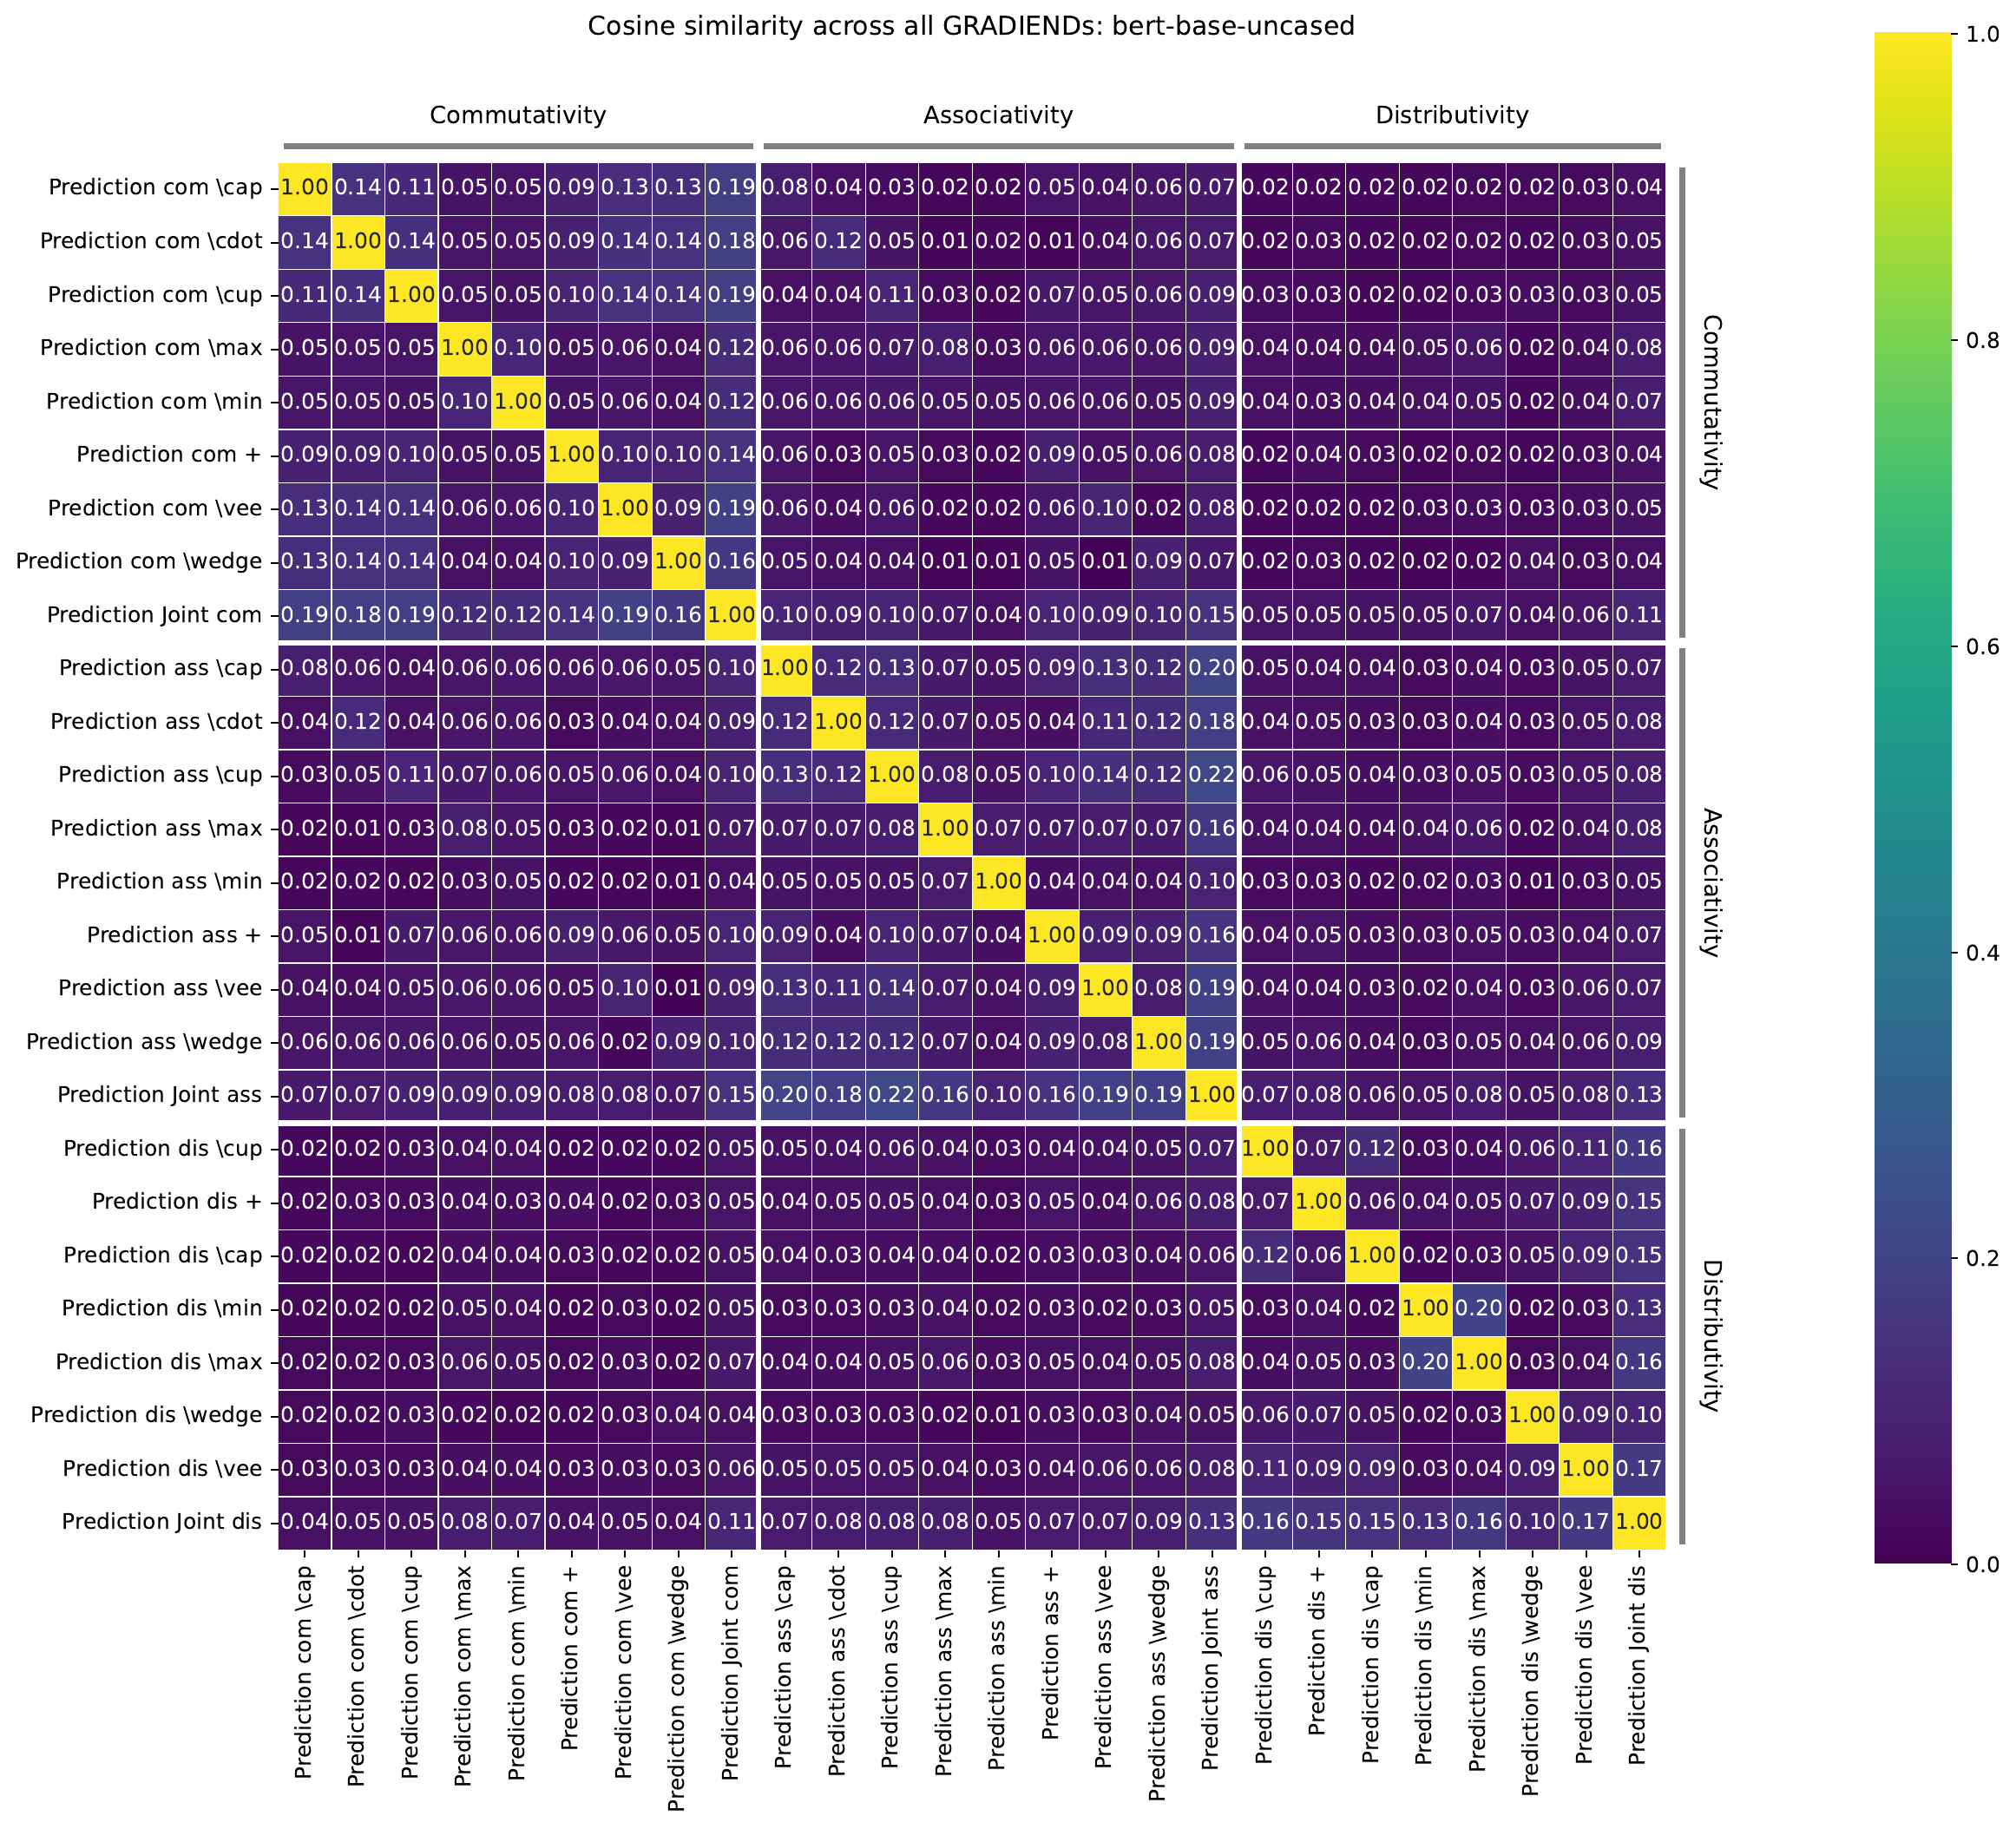
Cross-encoding
Semantic comparison: how well one GRADIEND's encoder separates another feature's data.
- High parameter overlap + low cross-encoding → same location, different feature signal.
- High cross-encoding off-diagonal → feature entanglement or shared representation.
For dense multilingual matrices (shared test pool, anchor-aligned squares), see Oriented cross-encoding matrix.
Comparing seeds
Seed comparison is cross-model comparison where the only deliberate difference is random initialization. Train and aggregate metrics with Multi-seed analysis first; then compare checkpoints in weight space if you need to know whether convergent seeds learned the same parameters.
Metric stability (multi-seed view)
view = trainer.multi_seed(selection="all_convergent", dispersion="std")
multi = view.evaluate_encoder(split="test")
print(multi["correlation"])                   # mean across seeds
print(multi["seeds"]["stats"]["correlation"]) # std, min, max, n
Report multi["seeds"]["n"] alongside means. Low encoder dispersion + high checkpoint
overlap → stable feature.
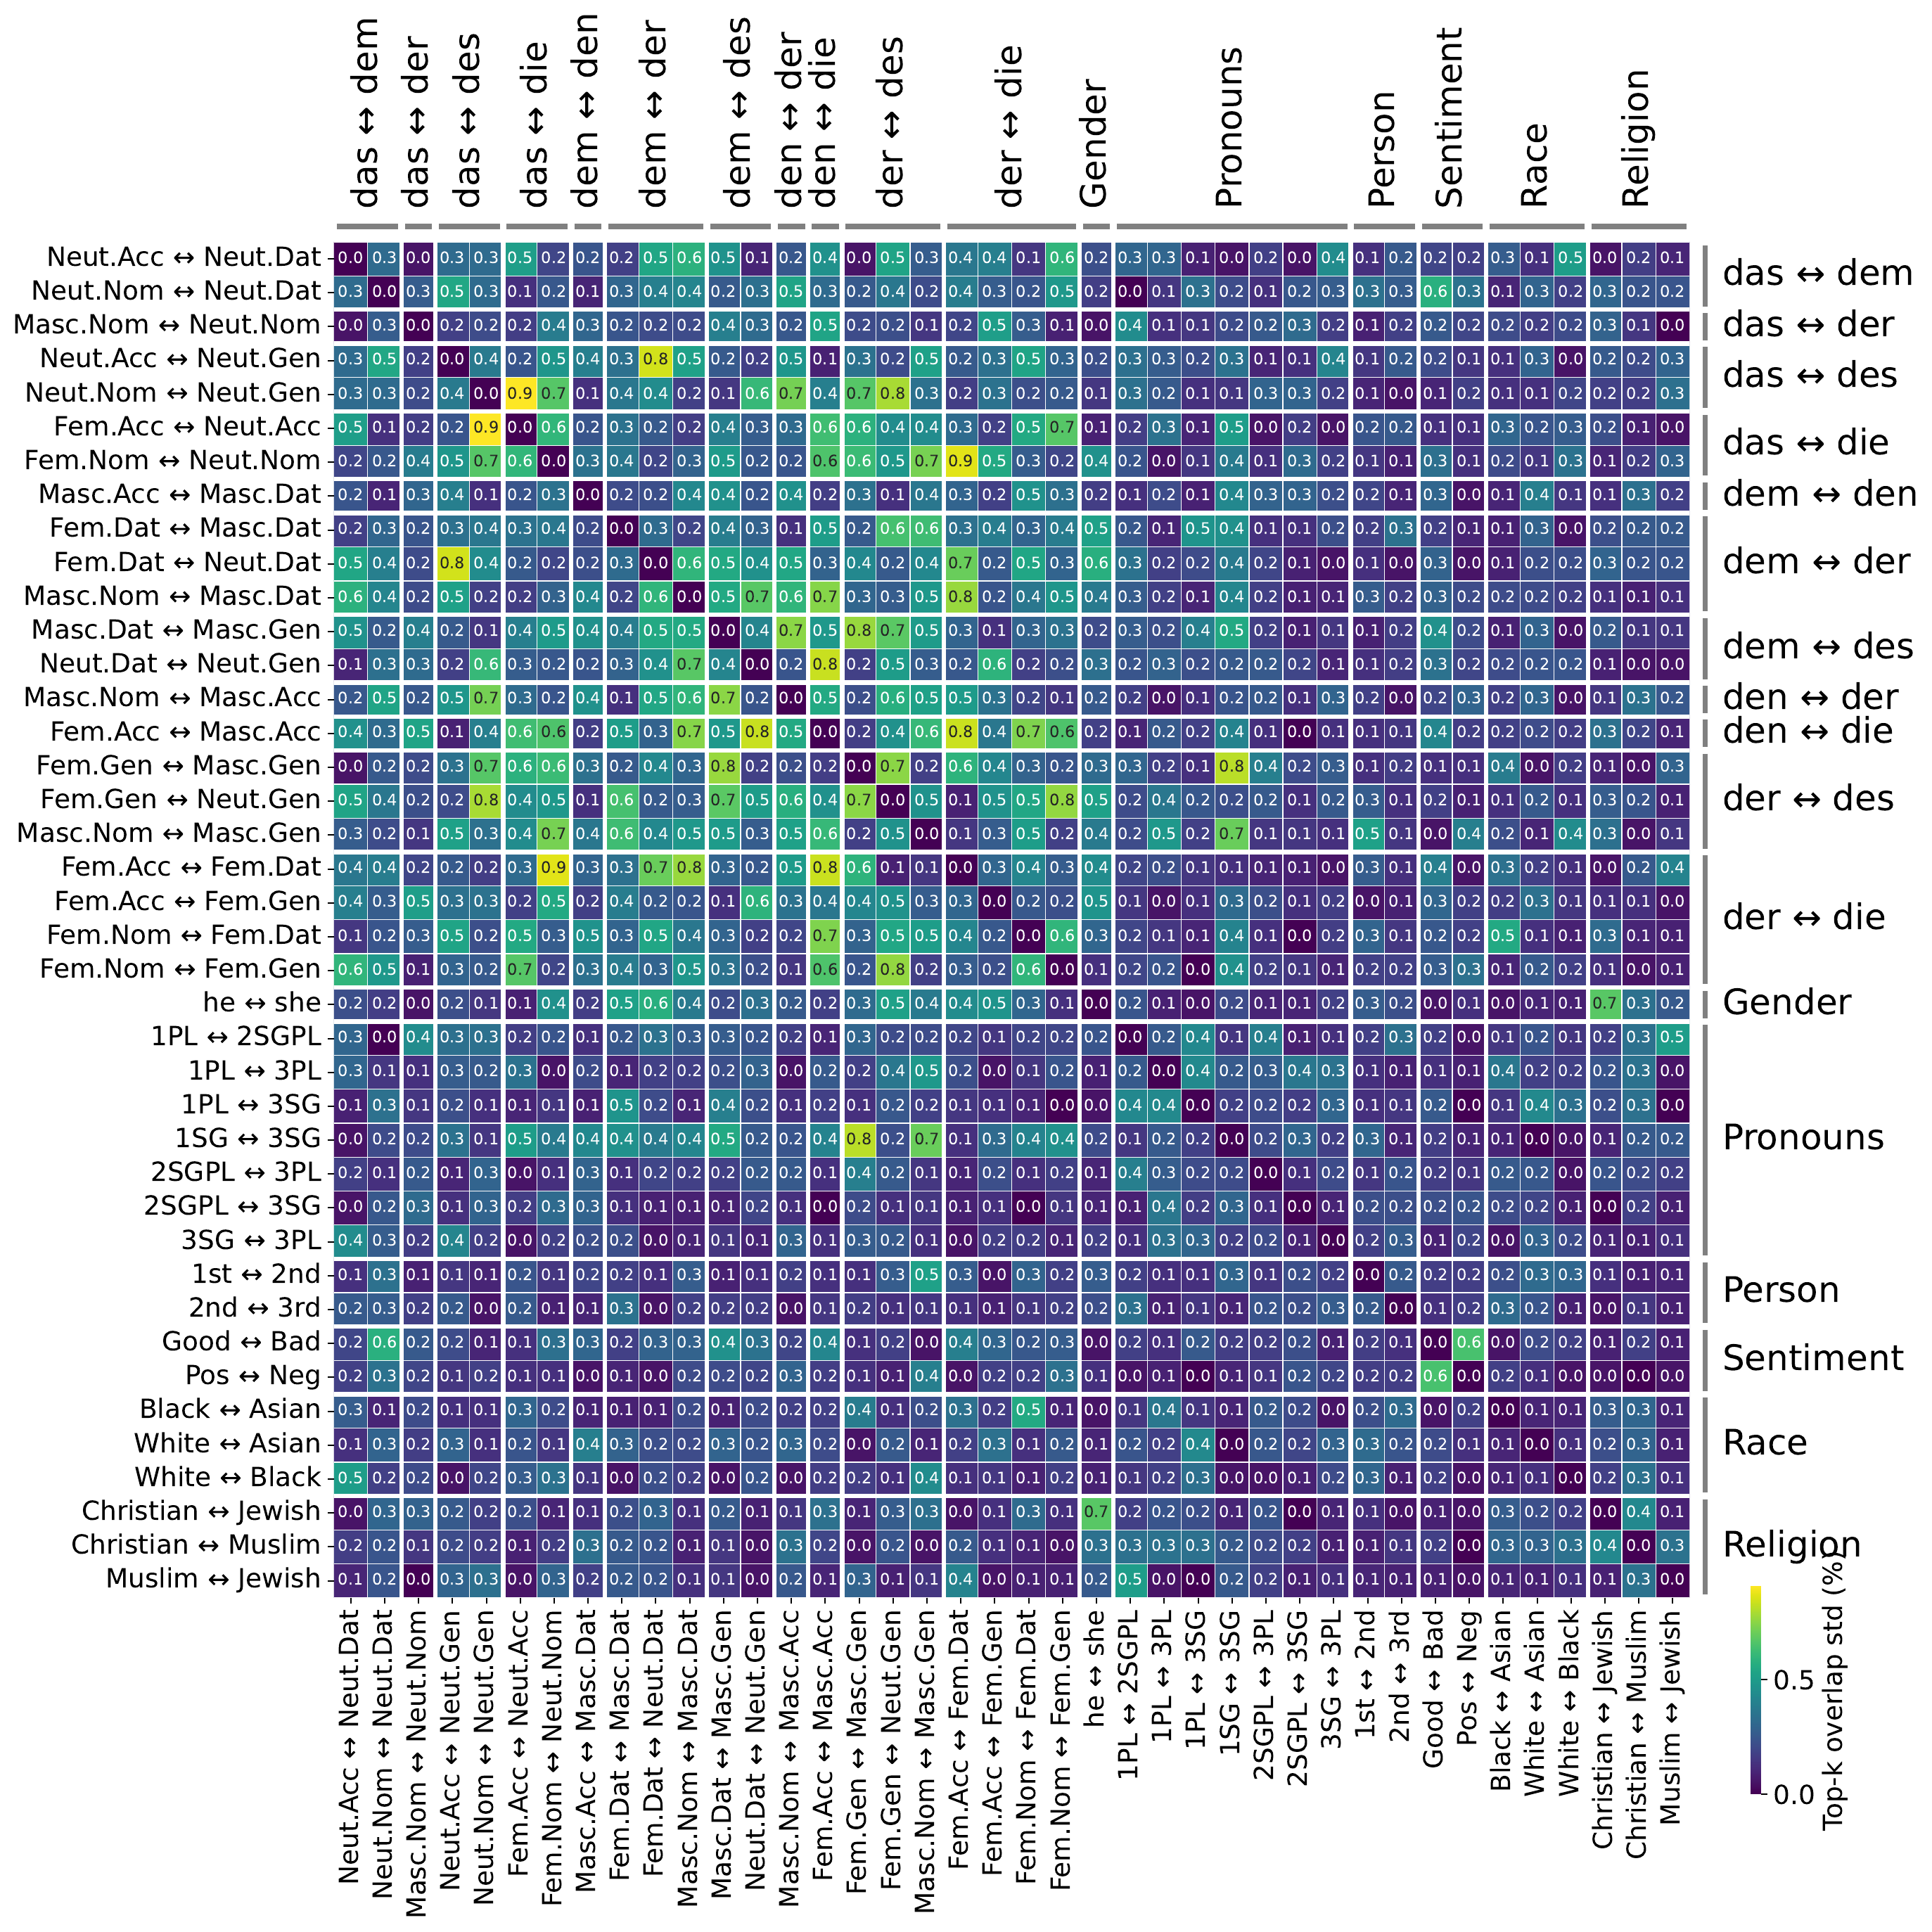
Most cells are at 0.0 or close to it, meaning the matched-seed top-k overlap percentages are effectively identical across the three BERT runs. In this example plot, even a brighter value around 0.7 means a standard deviation of only 0.7 percentage points, for example overlap values near 41.3%, 42.0%, and 42.7% around a 42% mean.
Checkpoint similarity (weight space)
To compare different checkpoints of the same feature (different GRADIEND models trained on different random seeds), use the compute_similarity_matrix helper.
from gradiend import compute_similarity_matrix, plot_comparison_heatmap

view = trainer.multi_seed(selection="all_convergent")
group = view.get_model(gradiend_only=True)  # SeedModelGroup when N > 1

comparison = compute_similarity_matrix(
    group,
    measure="topk_overlap",   # or "cosine"
    part="decoder-weight",
    topk=1000,
)
plot_comparison_heatmap(
    comparison,
    output_path="seed_topk_overlap.png",
    title="Top-k overlap across convergent seeds",
    show=False,
)
| Plot | What it shows |
|---|---|
| Pairwise top-k overlap | Shared high-importance parameters between seeds |
| Pairwise decoder cosine | Full decoder-vector agreement |
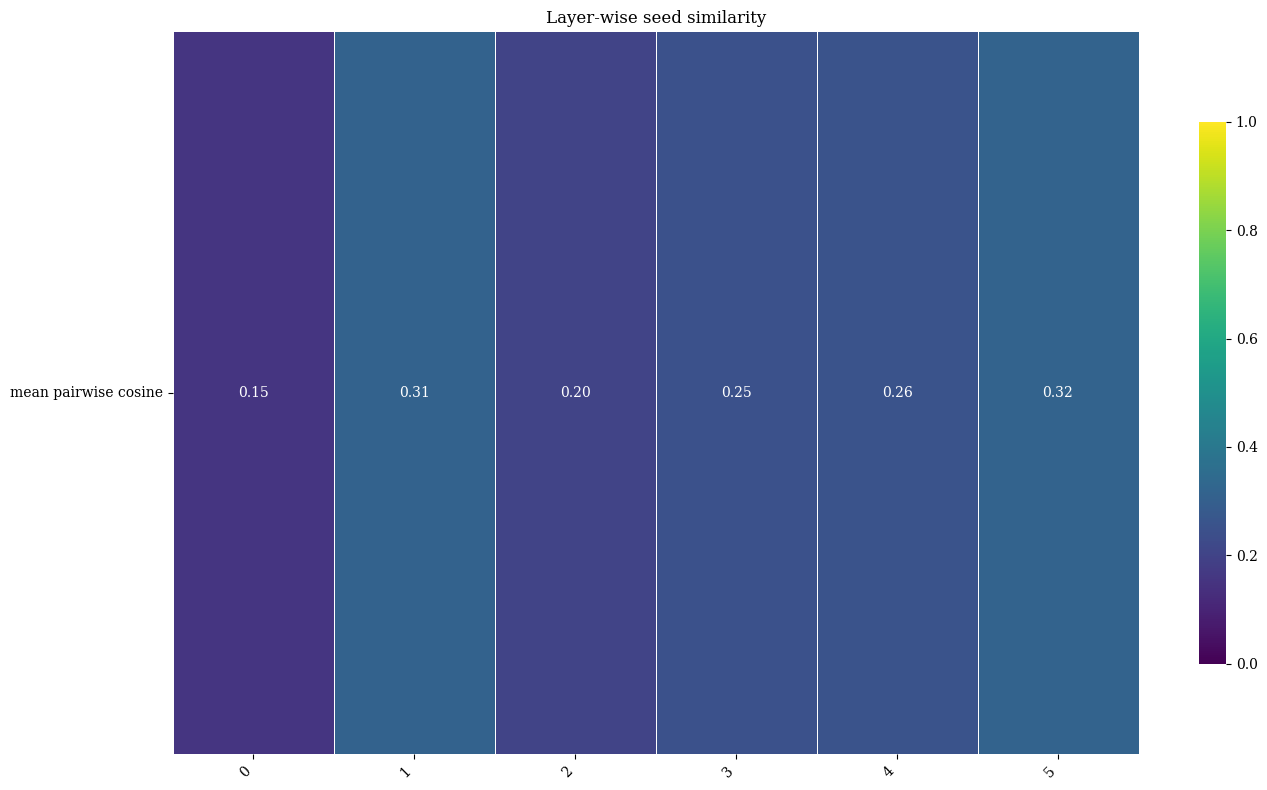
| Layer-wise similarity | Mean pairwise cosine per layer (compute_grouped_similarity_matrices, group_by="layer") |
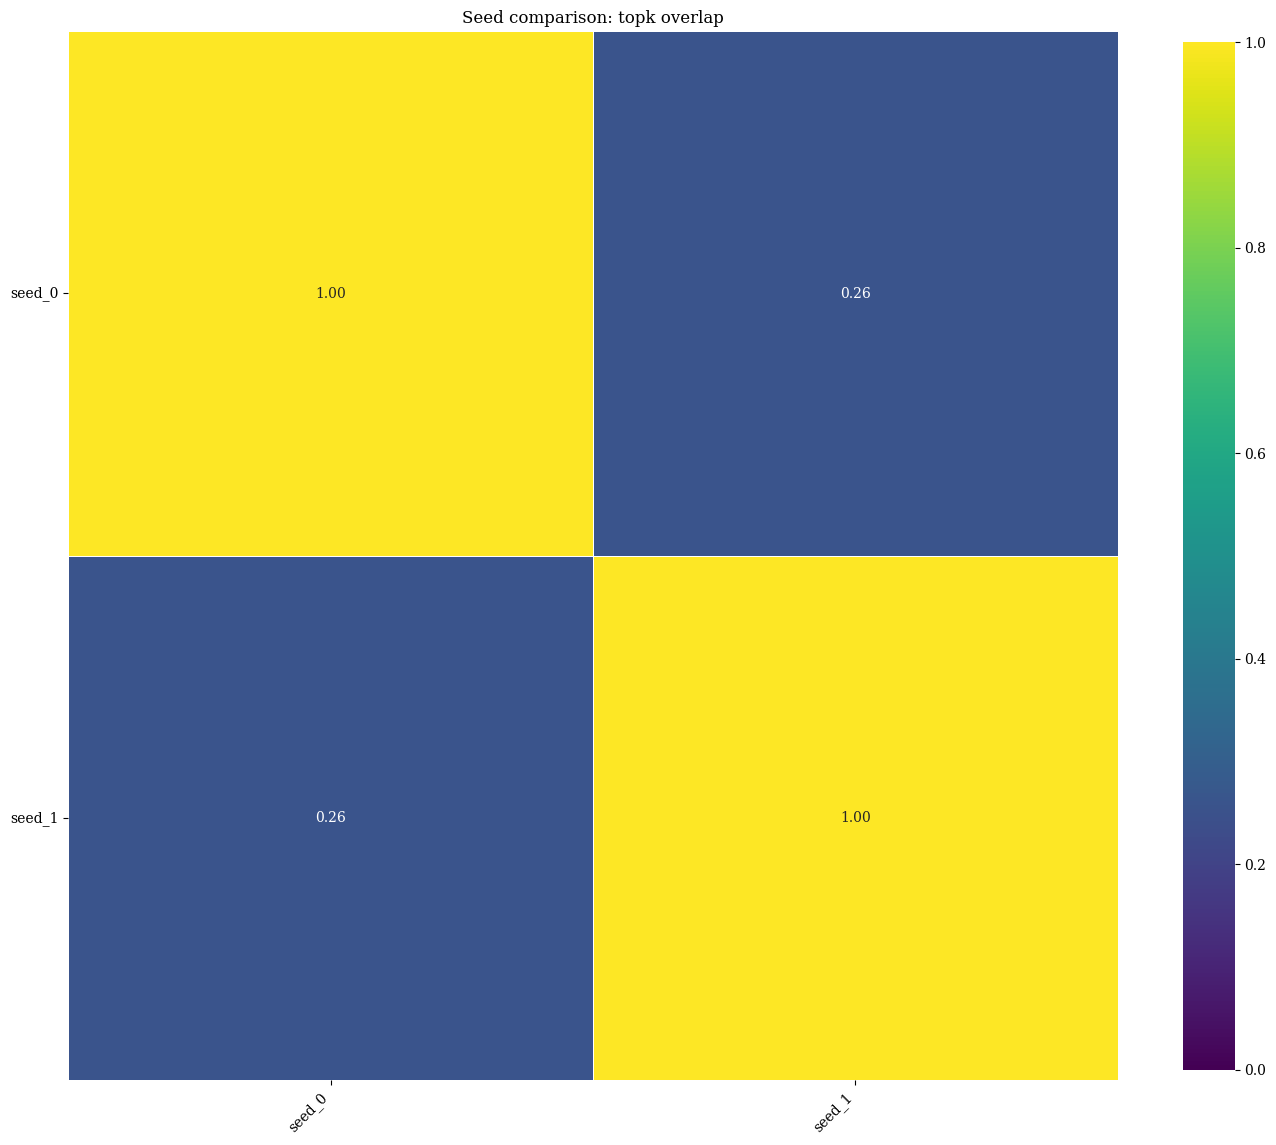
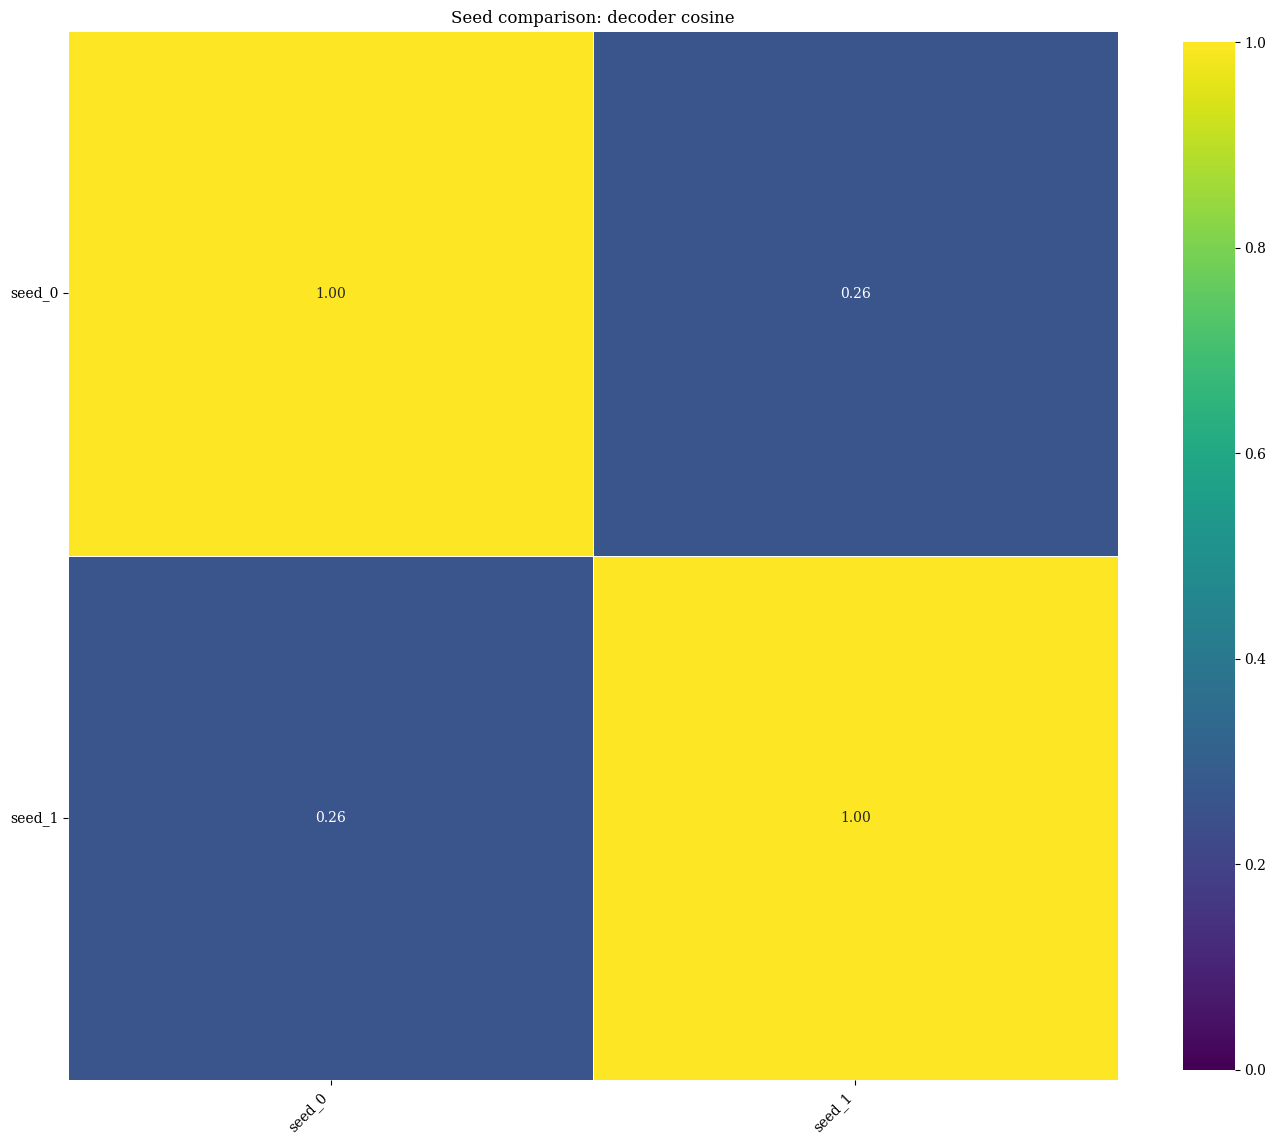
:material-file-code-outline: train_multi_seed_stability.py
(run_seed_comparison_heatmaps())